February 13, 2025
ANNOUNCEMENT
Dani van Weert, Cirrus AssessmentSeptember 17, 2024
E-assessment has revolutionized testing, transforming it into a faster, more efficient, and data-rich process. Gone are the days of cumbersome and time-consuming paper-based methods, where students would anxiously wait weeks for their results.
With e-assessments, we no longer have to sift through stacks of paper to analyze student performance. Instead, we have instant access to a wealth of data that reveals detailed insights into student understanding. The immediate availability of data allows us to quickly adapt our teaching strategies, addressing learning gaps as they arise and tailoring instruction to meet the diverse needs of our students. With a proactive approach, we can ensure that no student is left behind and that teaching methods continuously evolve to maximize effectiveness.
Imagine an English teacher who, after administering an e-assessment, discovers that students excelled in grammar but struggled with comprehension questions about a specific text. This immediate insight allows the teacher to adjust upcoming lessons straight away to focus more on reading comprehension strategies.
However, to ensure the insights from score reports are accurate and actionable, we must first focus on question difficulty, fairness, and reliability. By addressing these foundational aspects, we can be confident that our assessments are both challenging and unbiased, providing a solid basis for interpreting score reports. This ensures that the data we rely on truly reflects student performance and learning needs.
Let’s explore how each of these insights can help make education more effective and inclusive:
Understanding question difficulty is essential for creating balanced and effective assessments that improve learning outcomes. The more advanced e-assessment platforms offer several key statistics to help gauge how difficult a question is:
-Chance Score: Indicates the likelihood that students could guess the correct answer, helping to identify and adjust overly easy questions.
-P-value: Measures the proportion of students who answered each question correctly. A lower P-value indicates a more challenging question, while a higher P-value indicates an easier one.
-Pc-Value (Corrected P-Value): Provides a more nuanced measure of question difficulty by accounting for guessing.
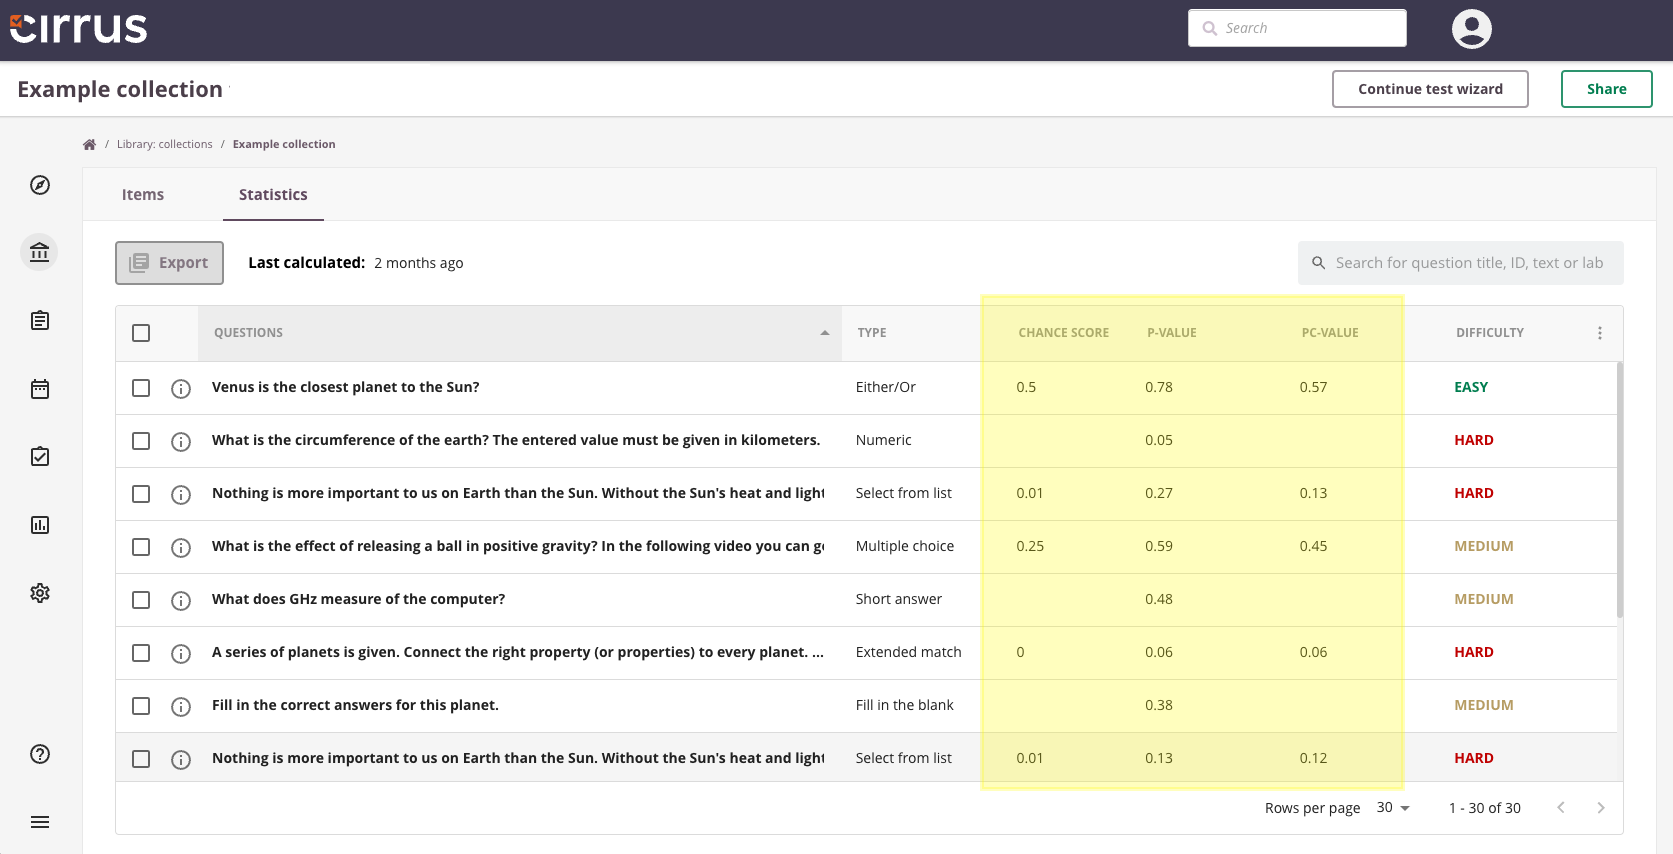
Questions that are too difficult may indicate misalignment with the curriculum or areas where students need more instruction. A balanced mix of question difficulties helps differentiate between varying levels of student performance, providing a clearer picture of overall understanding and ensuring assessments are fair and comprehensive.
E-assessment platforms offer powerful tools for evaluating the fairness and reliability of exams. Fairness ensures that all questions assess student knowledge without bias, providing an accurate representation of each student’s abilities. Reliability measures how consistently an exam evaluates student performance, reflecting the stability and accuracy of the test results over time. High reliability means that students would likely achieve the same scores if they took the test multiple times under similar conditions.
Key statistics to evaluate these aspects include:
-RIR Value: Reflects how well each question differentiates between high and low performers, which contributes to both fairness and reliability. A higher RIR value indicates better discrimination.
Enhancing test fairness starts with regularly reviewing RIR values to ensure that questions effectively distinguish between different levels of student performance. Questions with low RIR values should be adjusted or replaced to maintain fairness. For example, a history question that only a few students answer correctly might need revision to better align with what was taught in class, or it may indicate that the curriculum needs to be amended.
-RIT Value: Indicates the reliability of individual test items, ensuring consistency in assessment.
-Assessment Reliability: Overall reliability score for the entire test, indicating how consistently it measures student performance.
Improving test reliability involves monitoring RIT values to identify and refine unreliable test items. For instance, if a science question consistently yields varied answers despite stable instruction, it should be reviewed for clarity and relevance. Striving for a high overall reliability score ensures consistent results over time.

With the exam’s quality assured through balanced difficulty and verified fairness and reliability, we can now turn our attention to score reports. These reports provide detailed insights into student performance, highlighting strengths and weaknesses at both individual and cohort levels. Score Reports can be incredibly powerful when paired with item tagging. Item tagging involves linking specific test items to learning objectives, subjects or topics, allowing you to create specialized score reports for each candidate and the assessment overall.

For example, in a biology exam, each question might be tagged with a learning objective such as "Analyze the role of cell organelles", the subject "Genetics," and the topic "Ecology." After the exam, you can generate reports showing how each student performed in these areas, as well as cohort reports to identify overall trends and areas needing attention.
This approach works on two levels. For students, individual reports provide a clear picture of their strengths and weaknesses, enabling focused study and improvement. For educators, overall score reports offer valuable insights into student performance across different objectives and topics. By analyzing which topics most students struggled with, you can either decide to revisit these areas in class, adjust the curriculum, or use alternative teaching methods, ensuring no student is left behind.
E-assessment data provides a powerful tool for improving learning outcomes both now and in the future. By leveraging this easily accessible data, educators can refine their teaching methods, tailor support to student needs, and ensure fair and reliable assessments. This immediate feedback helps address learning gaps and optimize instructional strategies.
Additionally, longitudinal studies using e-assessment data offer valuable insights into student progress over time, allowing for ongoing curriculum improvement and better educational planning.
Consider using seed items in your assessments to generate valuable statistics without impacting student grades. Seed items are questions included in the test solely to gather data on question performance, such as difficulty and discrimination. These items do not count toward the final grade but provide essential insights into the effectiveness of the assessment. By analyzing seed item data, educators can continuously refine their assessments, ensuring that the primary questions are fair and accurately measure student understanding, leading to improved learning outcomes.
Looking ahead, advancements in data analytics could further personalize learning and enhance predictive capabilities, transforming education even more profoundly. For example, AI-driven analytics could predict which students are at risk of falling behind and recommend specific interventions, ensuring timely support and improved outcomes. These innovations promise a new era in education, where data-driven insights enable more precise and effective teaching strategies, ultimately leading to higher student success rates and more efficient educational systems.
For more information on how e-assessment can transform your teaching strategies, visit Cirrus Assessment.
February 13, 2025
ANNOUNCEMENT
January 21, 2025
ANNOUNCEMENT

September 3, 2024
ANNOUNCEMENT

August 21, 2024
ANNOUNCEMENT

July 12, 2024
ANNOUNCEMENT
May 3, 2024
ANNOUNCEMENT

April 26, 2024
ANNOUNCEMENT

April 22, 2024
ANNOUNCEMENT

March 29, 2024
ANNOUNCEMENT

January 11, 2024
ANNOUNCEMENT

November 22, 2023
ANNOUNCEMENT

November 02, 2023
ANNOUNCEMENT
October 20, 2023
ANNOUNCEMENT

October 2, 2023
ANNOUNCEMENT
May 5, 2023
ANNOUNCEMENT

April 22, 2023
ANNOUNCEMENT

April 10, 2023
ANNOUNCEMENT

October 6, 2022
ANNOUNCEMENT
September 30, 2022
ANNOUNCEMENT

September 2, 2022
ANNOUNCEMENT

August 24, 2022
ANNOUNCEMENT

April 29, 2022
ANNOUNCEMENT

April 22, 2022
ANNOUNCEMENT

March 25, 2022
ANNOUNCEMENT

March 18, 2022
ANNOUNCEMENT

November 24, 2021
ANNOUNCEMENT
August 24, 2021
ANNOUNCEMENT

July 31, 2021
ANNOUNCEMENT

May 05, 2021
ANNOUNCEMENT

March 10, 2021
ANNOUNCEMENT